Solar energy continues to rise as one of the smartest investments for homeowners—driven by falling equipment costs, stable incentives, and rising utility rates. But the biggest question most homeowners face is simple:
How do I pay for it?
Whether your goal is maximizing savings, minimizing upfront costs, boosting home value, or eliminating utility risk, the financing method you choose meaningfully shapes your returns.
This extended guide breaks down three core financing options—Cash Purchase, Solar Loans, and Solar Leases/PPAs—using five custom charts to illustrate long-term impact, payback periods, lifetime savings, and cash-flow behavior.
Your financing structure determines:
Ownership unlocks tax credits and equity.
Only owners receive the Federal 30% Investment Tax Credit (ITC).
Paying upfront vs. paying over time drastically changes ROI.
Owned systems add value; leased systems add complexity.
Let’s break down each option with data.
A cash purchase is ideal for homeowners looking for maximum financial benefit. Paying upfront removes interest and monthly obligations while giving you full control and all incentives.
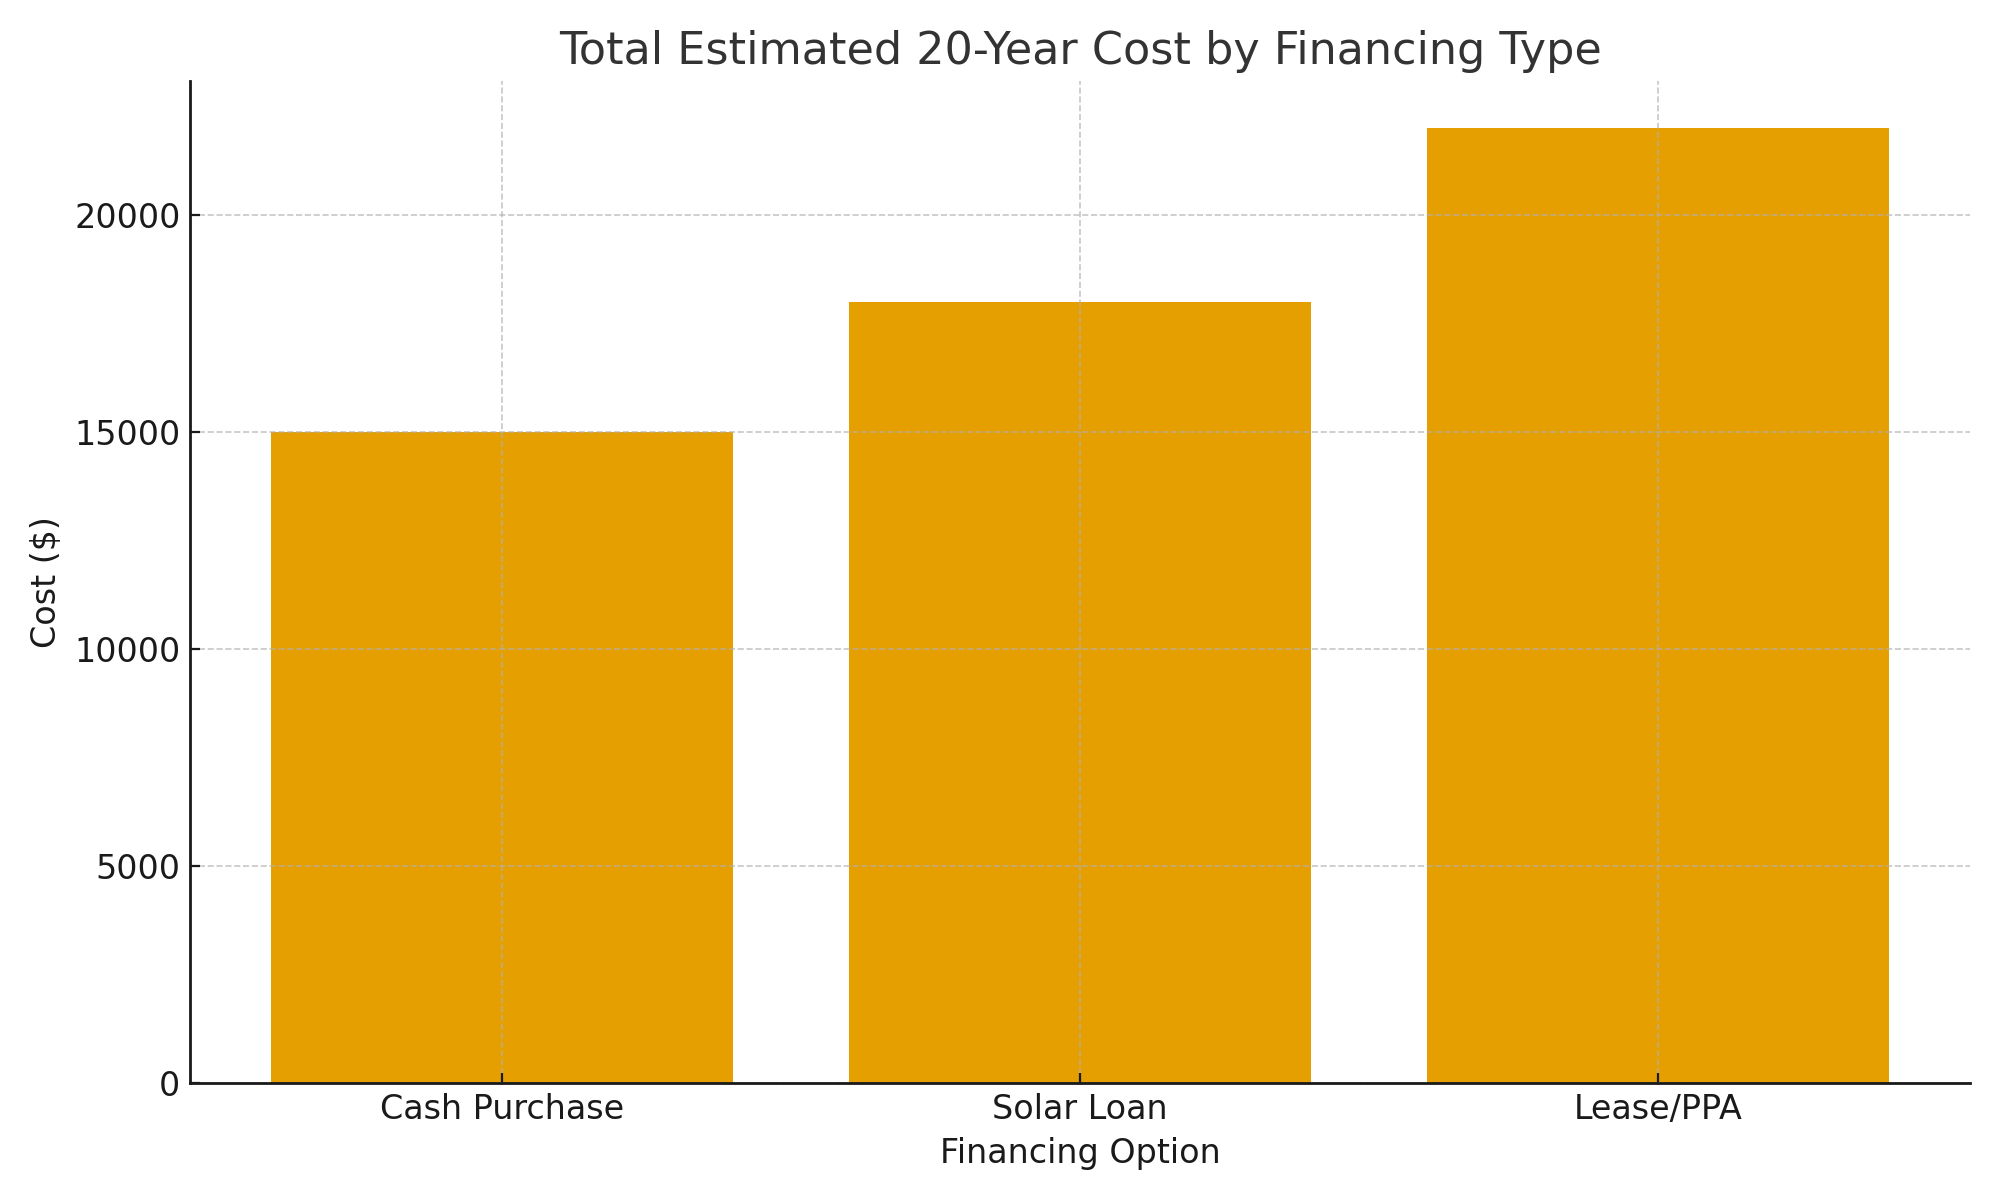
Cash purchase shows the lowest total cost, even when including inverter replacement and maintenance.
Solar loans make ownership accessible with little to no upfront cost. You still get the tax credit, and monthly payments are often offset by energy savings.
Loans have a longer payback than cash, but significantly shorter than lease/PPA.
With leases and PPAs, a third-party company owns your system. You pay either a fixed monthly amount (lease) or for the produced electricity at a set rate (PPA).
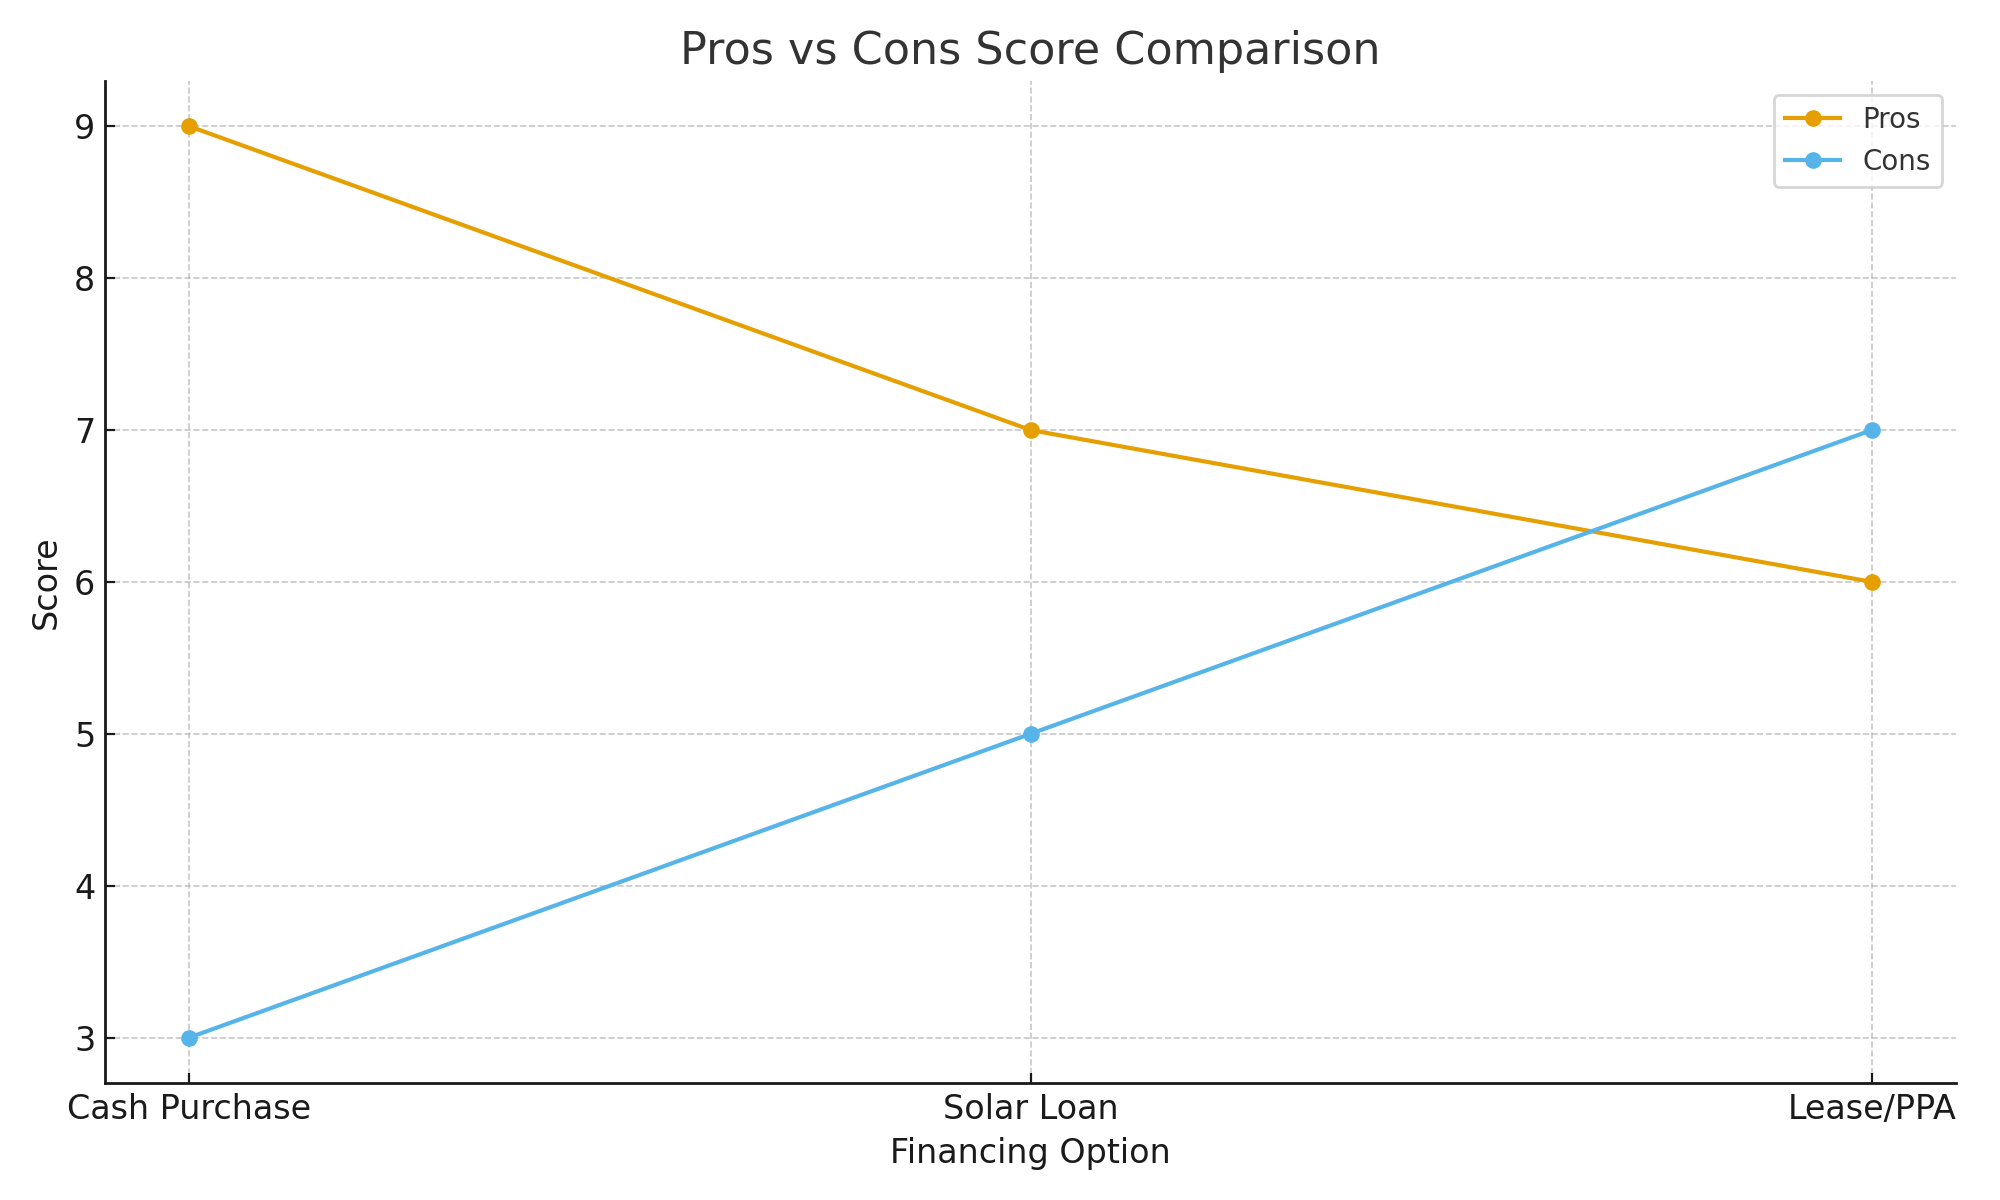
Leases offer convenience but have the widest gap between pros and cons.
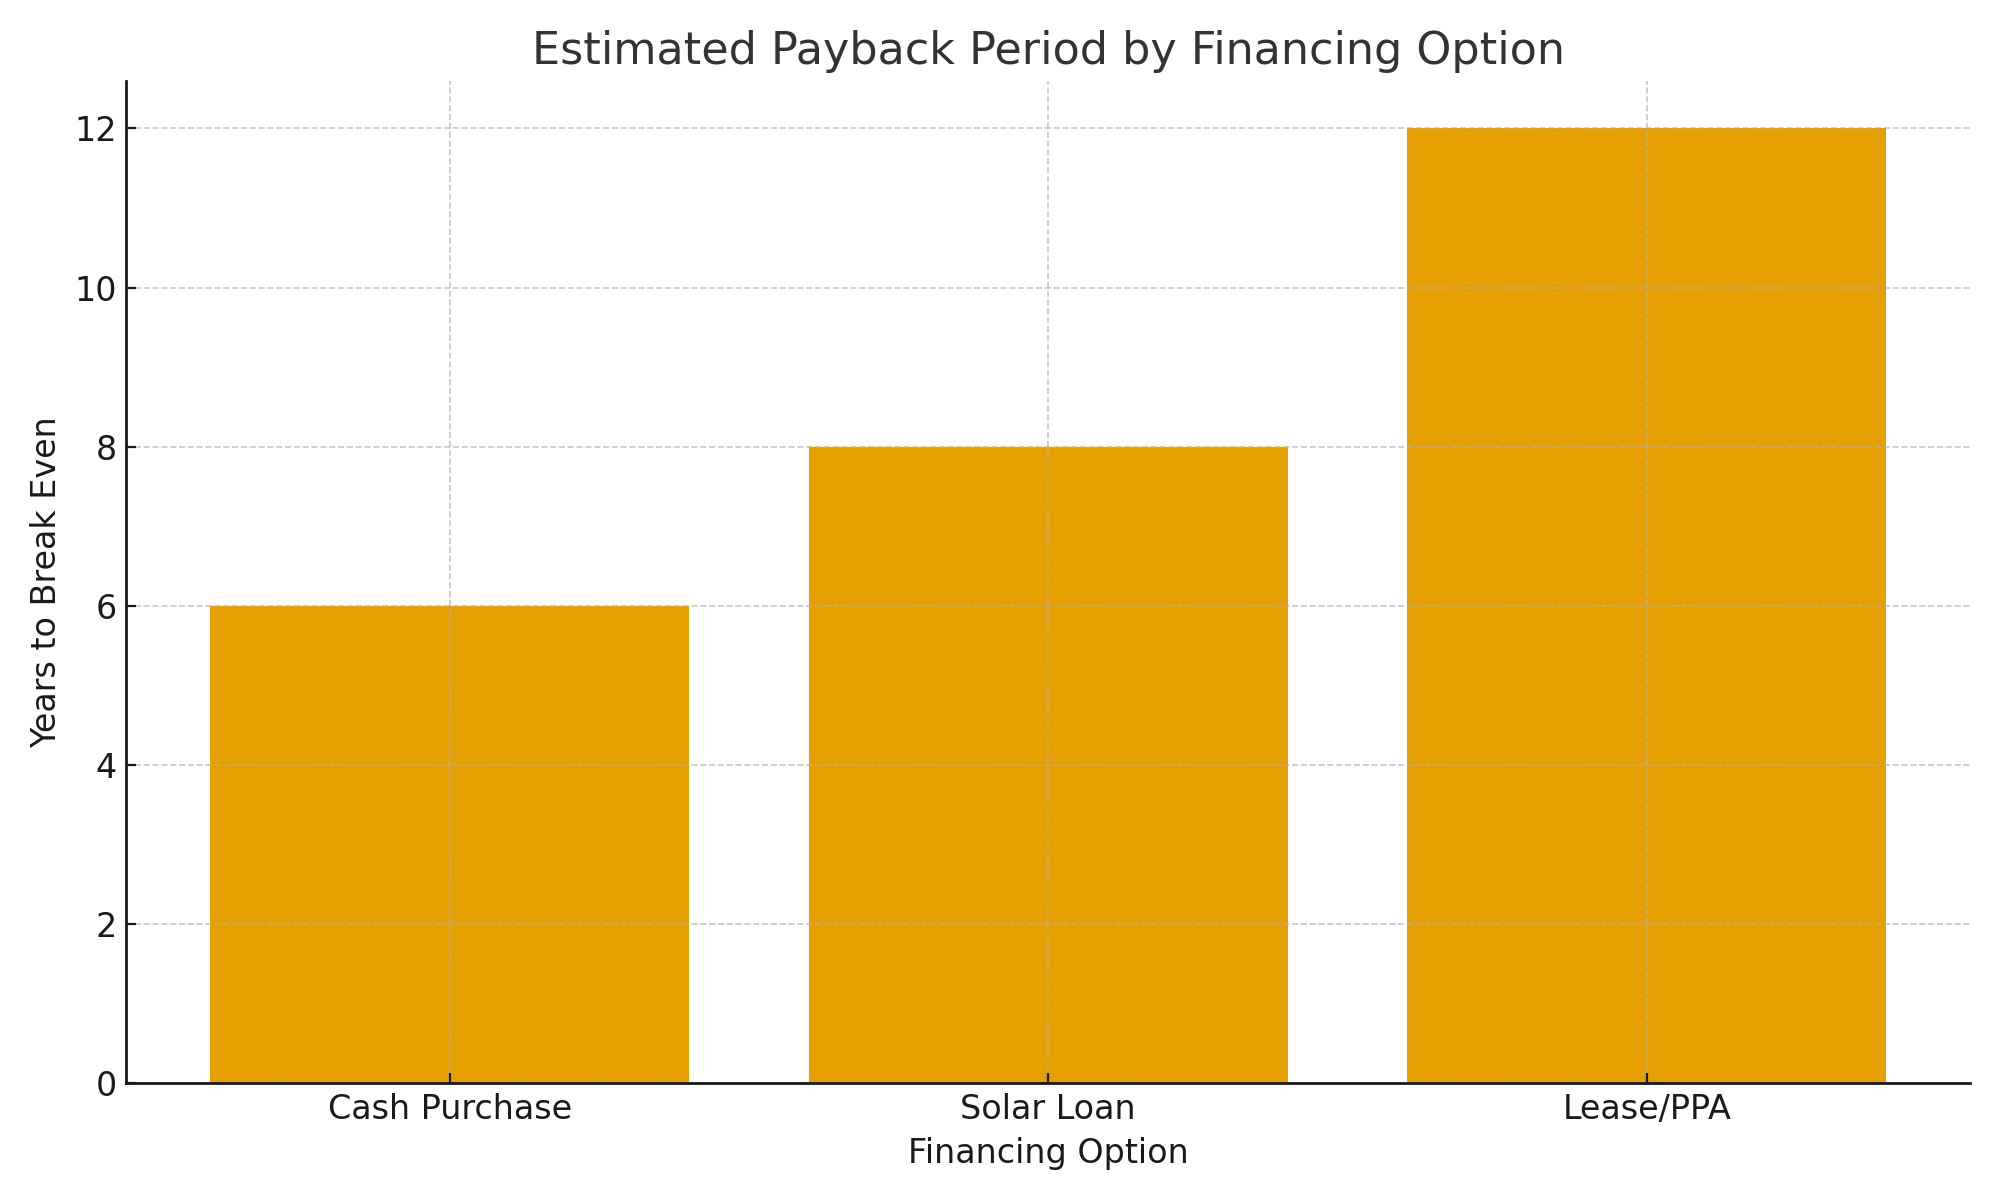
📊 See: solar_payback.png
Financing TypePayback (Years)Cash~6Loan~8Lease/PPA~12
Cash and loans pay themselves back well within the system’s expected 25–30 year lifespan, while leases offer slower or minimal “payback” because you’re essentially renting the system.
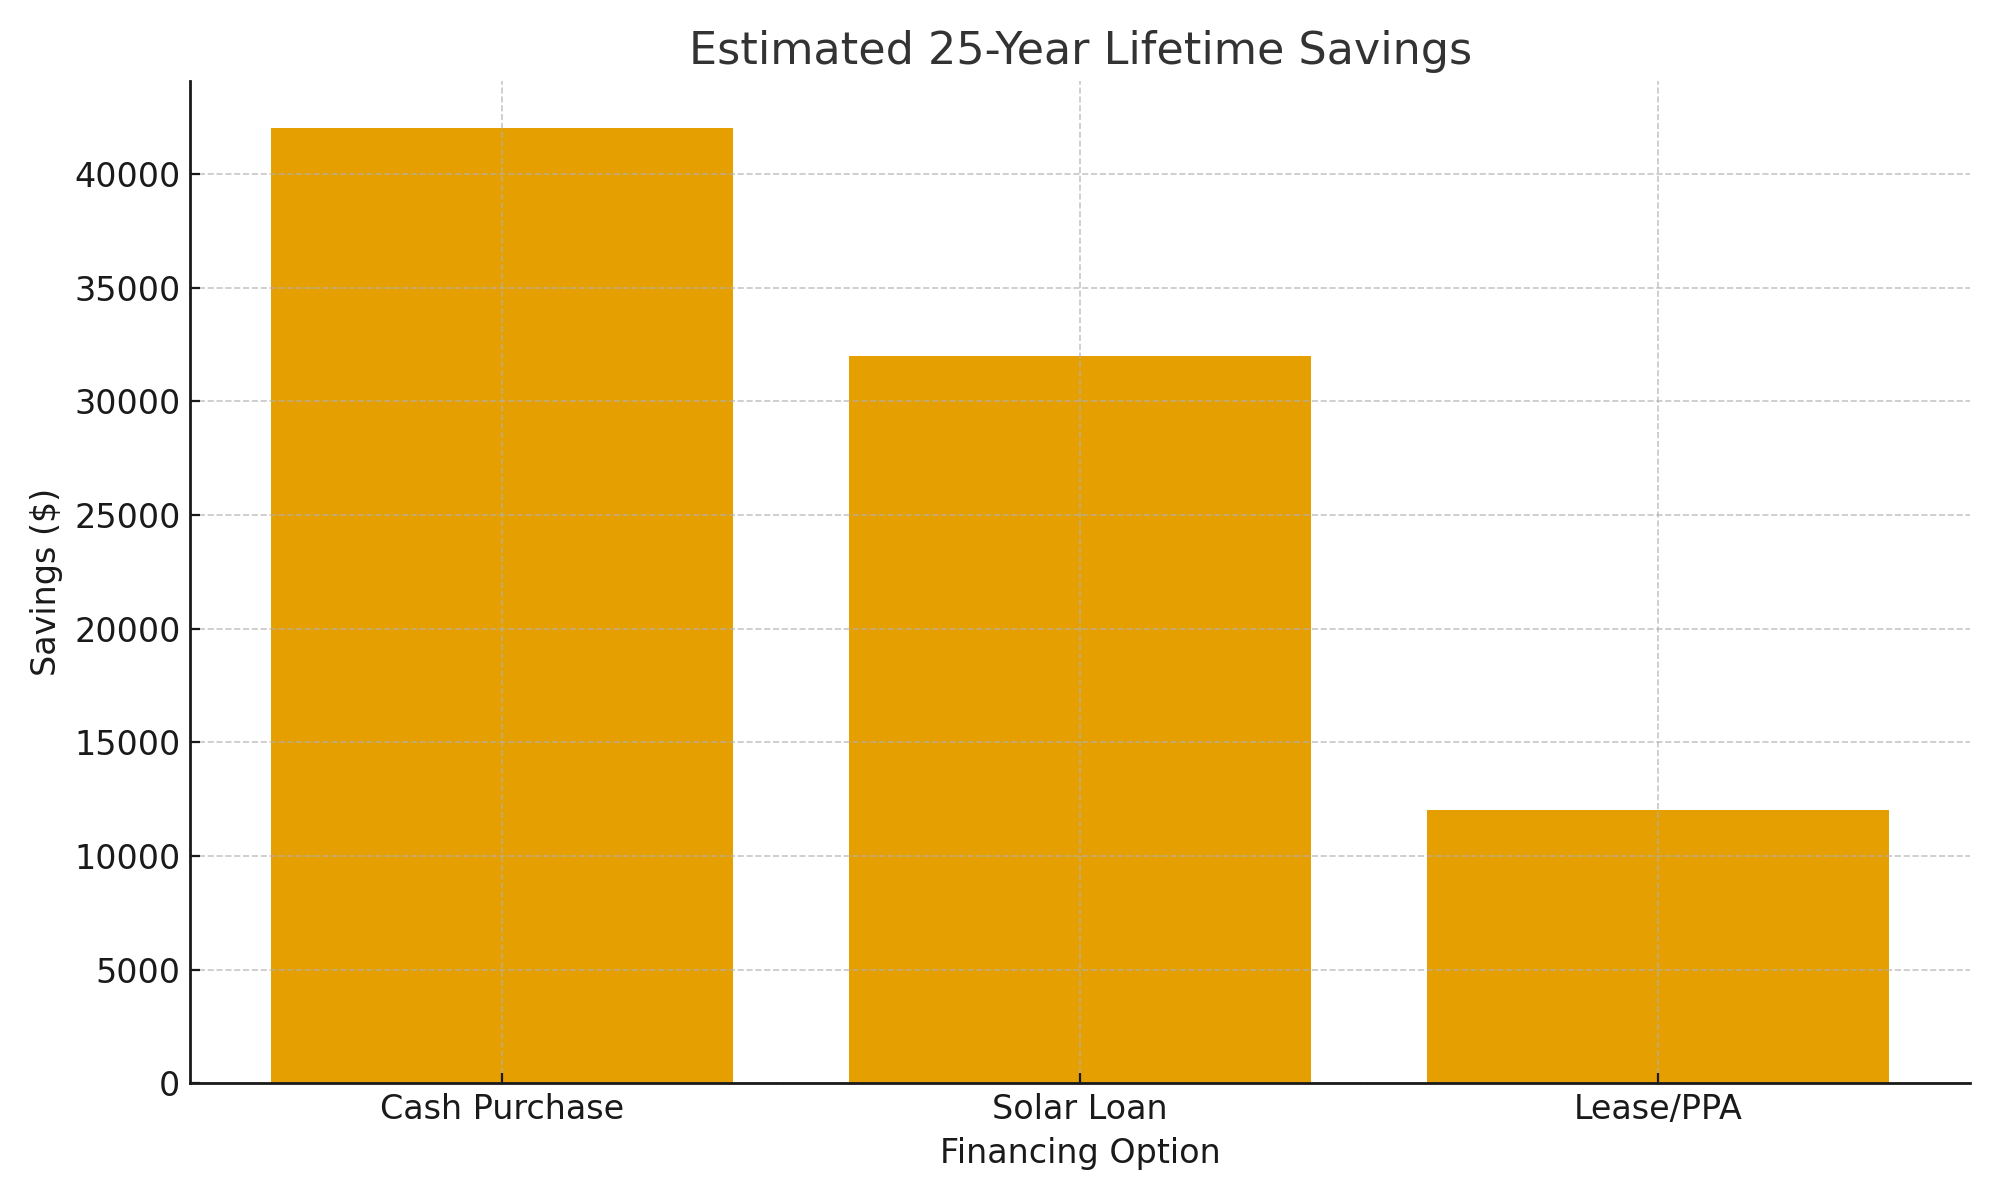
Financing TypeLifetime SavingsCash~$42,000Loan~$32,000Lease/PPA~$12,000
Ownership clearly dominates long-term savings.
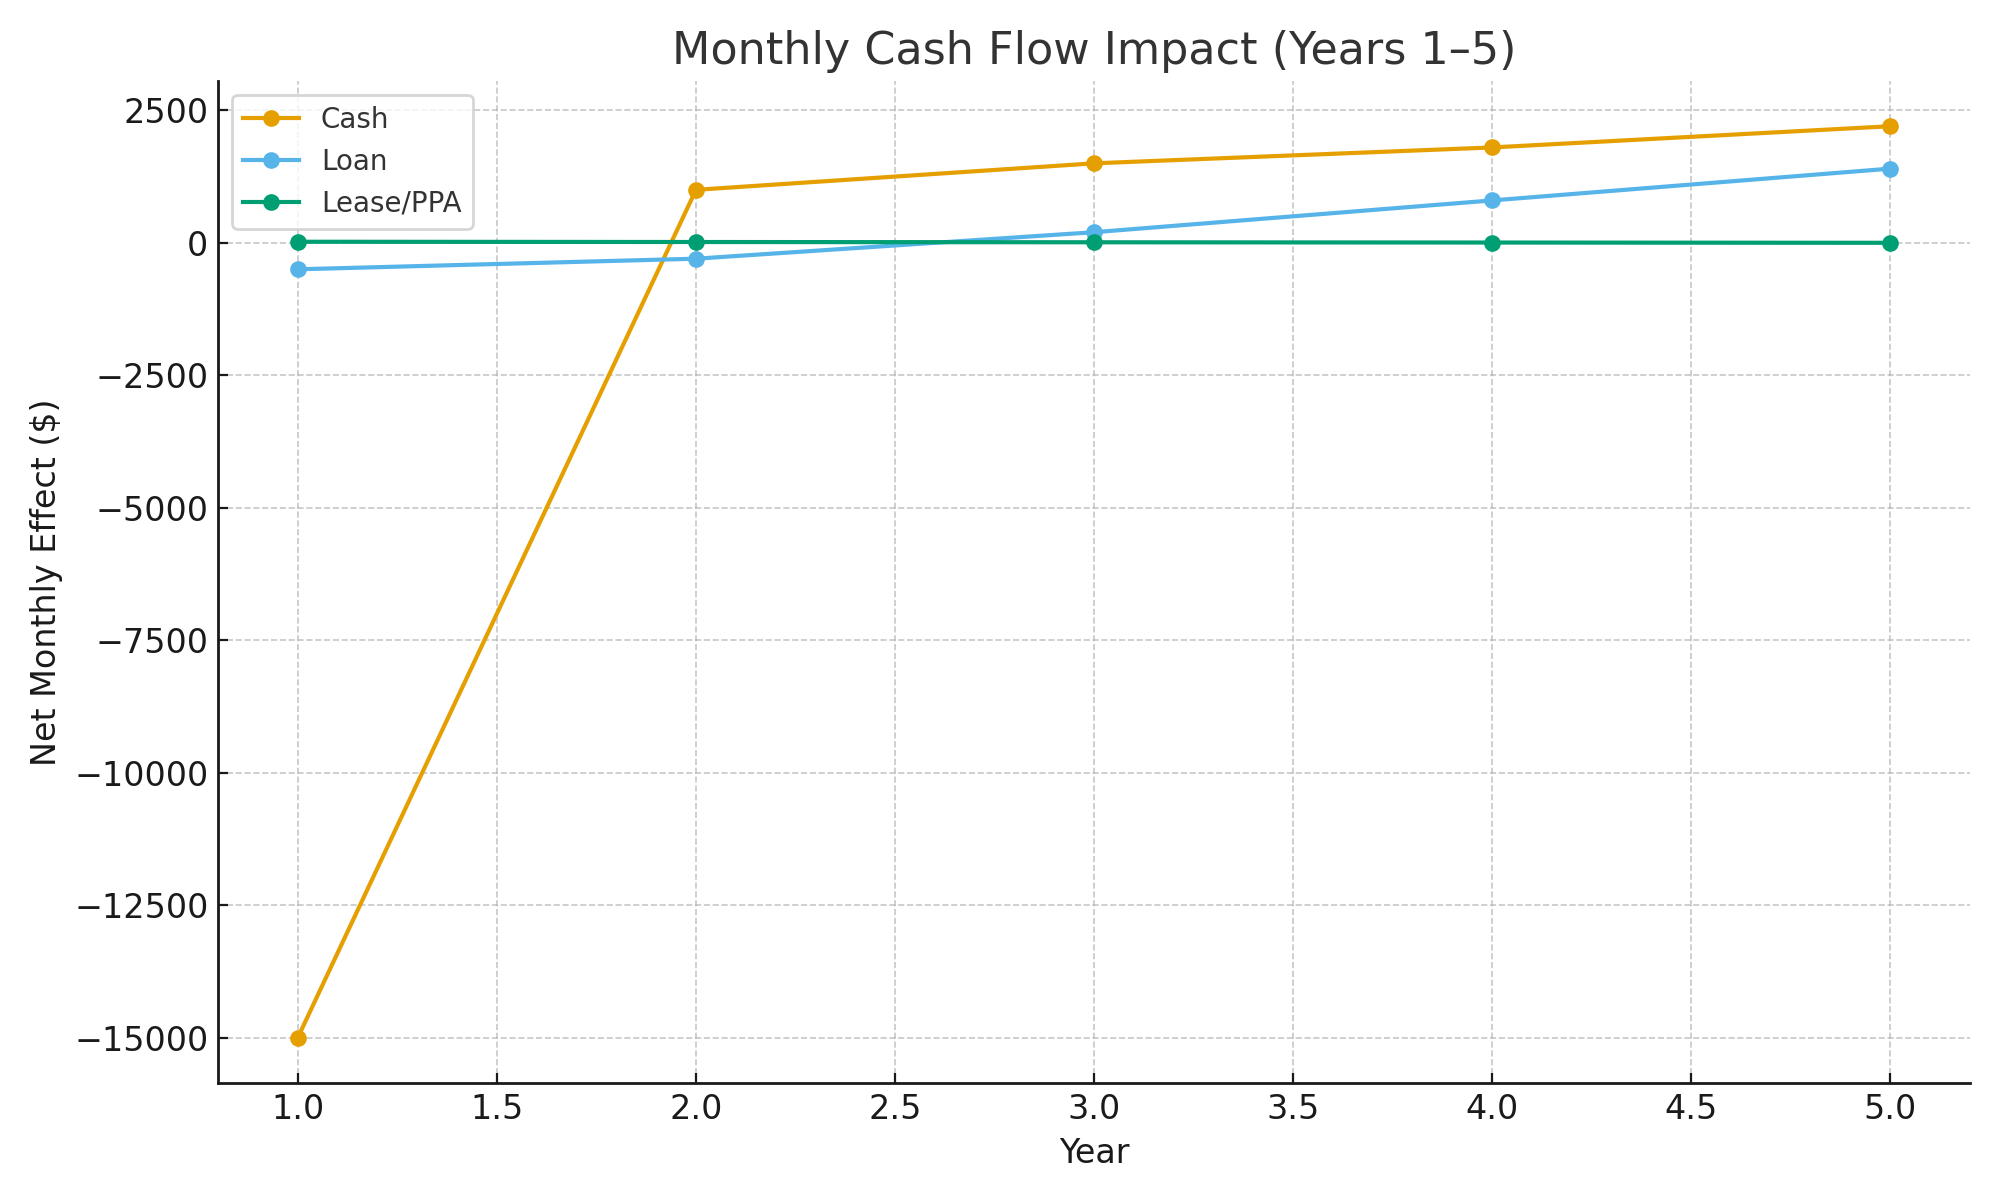
This chart shows how each financing type affects your monthly financial position over the first five years.
Cash Purchase:
Large upfront cost in year 1, then immediate strong positive monthly savings.
Loan:
Small negative cash flow in years 1–2 due to loan payments, turning positive as utility savings grow.
Lease/PPA:
Near-neutral from the start—no big savings, but also minimal cost difference.
Cash: Lowest total cost
Loan: Higher total cost due to interest
Lease/PPA: Highest long-term cost
Cash: Highest benefit ratio
Loan: Balanced
Lease/PPA: Convenience vs. lower financial upside
Thanks to the flexibility of cash, loans, and lease/PPA models, solar is no longer something only cash-ready homeowners can access. Whether you're trying to maximize long-term returns or minimize immediate expenses, solar financing offers a path for almost every situation.


